


Electronegativity is one of the most crucial concepts in chemistry, and understanding it is vital for comprehending how atoms interact in chemical reactions. The electronegativity chart provides a visual representation of how different elements attract electrons in a chemical bond. In this article, we will delve into the concept of electronegativity, how to interpret the electronegativity chart, and its significance in chemical bonding, molecular properties, and real-world applications.
Table of Contents
What is Electronegativity?
Electronegativity refers to the ability of an atom to attract shared electrons when it forms a chemical bond with another atom. This property plays a critical role in determining the nature of chemical bonds. When two atoms with different electronegativities form a bond, the more electronegative atom will attract the bonding electrons more strongly, creating a polar covalent bond. If the electronegativity difference is large enough, the more electronegative atom will completely take the electron, forming an ionic bond.
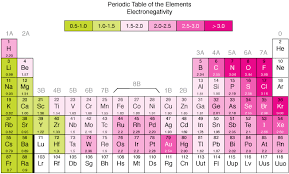
The concept of electronegativity was introduced by Linus Pauling in 1932. He developed the Pauling scale, which assigns numerical values to elements to quantify their electronegativity. The electronegativity chart displays these values for every element in the periodic table. Fluorine, which has an electronegativity of 3.98, is the most electronegative element, while cesium (Cs) and francium (Fr) have the lowest electronegativity values, around 0.7.
Understanding the electronegativity chart allows chemists to predict how atoms will behave in chemical reactions, helping to determine whether bonds will be ionic, covalent, or polar covalent.
Why is the Electronegativity Chart Important?

The electronegativity chart is fundamental for understanding how atoms interact in different chemical contexts. It helps us predict the type of bond that will form between two atoms and the overall structure and behavior of molecules.
- Predicting Bond Type: The electronegativity difference between two atoms determines the type of bond they will form:
- Ionic bonds form when there is a significant difference in electronegativity (usually greater than 1.7). One atom will donate electrons to another, resulting in the formation of oppositely charged ions.
- Covalent bonds form when two atoms share electrons equally or nearly equally. The atoms involved have similar electronegativities (usually less than a 0.4 difference).
- Polar covalent bonds occur when atoms share electrons unequally due to a moderate electronegativity difference (between 0.4 and 1.7), resulting in a dipole.
- Understanding Molecular Polarity: By using the electronegativity chart, chemists can predict the polarity of a molecule. If the atoms in a molecule have different electronegativities and the molecule is asymmetrical, it will be polar. A polar molecule has a positive and negative end, making it behave differently in various chemical environments compared to nonpolar molecules.
- Chemical Reactivity: Electronegativity also affects the reactivity of elements. Elements with high electronegativity, such as fluorine and oxygen, tend to be more reactive because they strongly attract electrons. In contrast, elements with low electronegativity, such as alkali metals, are more likely to lose electrons and form ionic bonds.
How to Read the Electronegativity Chart
The electronegativity chart is arranged in a way that makes it easy to compare the electronegativity of different elements. Here’s how you can read it:
- Element Placement: Elements are arranged according to their atomic number and their position on the periodic table. However, they are also organized by their electronegativity values. As you move across a period from left to right, electronegativity increases. This is because atoms in the rightmost columns of the periodic table have more protons, which increases their ability to attract electrons. As you move down a group, electronegativity decreases because the atomic size increases, and the outer electrons are farther from the nucleus, which weakens the attraction.
- High and Low Electronegativity: The electronegativity chart shows that the most electronegative elements, such as fluorine, oxygen, and nitrogen, are located in the upper-right corner of the periodic table. The least electronegative elements, such as cesium and francium, are located in the lower-left corner.
- Comparing Electronegativity: To compare the electronegativity of two elements, look at their respective values on the electronegativity chart. If the difference between the two is large, the bond formed will be ionic. If the difference is small, the bond will be covalent, and if the difference is moderate, it will be polar covalent.
Electronegativity and Chemical Bonding
The electronegativity chart is essential for understanding the nature of chemical bonds. By comparing the electronegativity values of two atoms, we can predict how they will bond and whether they will form an ionic, covalent, or polar covalent bond.
- Ionic Bonds: Ionic bonds occur when one atom has a much higher electronegativity than the other. In this case, the more electronegative atom pulls the electron(s) completely away from the less electronegative atom, creating positively and negatively charged ions. A classic example of ionic bonding is sodium chloride (NaCl), where sodium (Na) donates an electron to chlorine (Cl), forming Na+ and Cl- ions.
- Covalent Bonds: Covalent bonds occur when atoms share electrons. If the electronegativity difference between the two atoms is very small (less than 0.4), they share the electrons equally, resulting in a nonpolar covalent bond. For example, in a hydrogen molecule (H2), both atoms have the same electronegativity and share electrons equally.
- Polar Covalent Bonds: Polar covalent bonds form when two atoms with different electronegativities share electrons, but the electrons are not shared equally. The atom with the higher electronegativity will pull the electrons closer to itself, creating a dipole. A common example is water (H2O), where oxygen is more electronegative than hydrogen, resulting in a partial negative charge on the oxygen and a partial positive charge on the hydrogens.
Electronegativity and Molecular Polarity
The electronegativity chart helps predict the overall polarity of molecules. The polarity of a molecule depends not only on the electronegativity of its atoms but also on the shape of the molecule. A molecule with polar bonds may still be nonpolar if its geometry is symmetrical, causing the dipoles to cancel out.
- Polar Molecules: A molecule is polar if it has polar covalent bonds and an asymmetrical shape. For example, in a water molecule (H2O), the oxygen atom attracts electrons more strongly than the hydrogen atoms, creating a partial negative charge on oxygen and partial positive charges on the hydrogens. The bent shape of the molecule ensures that these charges do not cancel out, making water a polar molecule.
- Nonpolar Molecules: A molecule is nonpolar if it has nonpolar bonds or if the polar bonds cancel each other out due to symmetry. For instance, carbon dioxide (CO2) has polar covalent bonds between carbon and oxygen, but the linear shape of the molecule results in the cancellation of the dipoles, making the molecule nonpolar.
By examining the electronegativity chart and the structure of a molecule, we can determine whether it is polar or nonpolar and predict its behavior in different environments.
Electronegativity Trends and Periodic Table
The electronegativity chart follows periodic trends that correspond to the position of elements in the periodic table. These trends help us predict the behavior of elements and compounds.
- Across a Period (Left to Right): As you move from left to right across a period, electronegativity increases. This is because atoms have more protons, which results in a greater attraction for electrons. For example, fluorine, which is on the far right of the periodic table, has the highest electronegativity.
- Down a Group (Top to Bottom): As you move down a group in the periodic table, electronegativity decreases. This is because atoms become larger and the electrons in the outermost shell are farther from the nucleus, reducing the atom’s ability to attract electrons. For example, francium, located at the bottom of Group 1, has the lowest electronegativity.
Applications of Electronegativity in Chemistry
The electronegativity chart has a wide range of applications in chemistry and other fields.
- Chemical Bonding and Molecular Structure: Understanding electronegativity is key to predicting the types of bonds that form between atoms. Whether an ionic, covalent, or polar covalent bond forms depends on the electronegativity differences between the atoms involved.
- Reactivity in Chemical Reactions: Electronegativity influences the reactivity of elements. Elements with high electronegativity, such as fluorine and oxygen, are more reactive and readily form bonds with less electronegative elements.
- Pharmaceuticals and Drug Design: The electronegativity chart is used in the design of drugs, where the interactions between drug molecules and their targets are influenced by electronegativity. The stronger the attraction of a drug to its target, the more likely it will bind and produce the desired effect.
- Environmental Chemistry: In environmental chemistry, understanding electronegativity is essential for predicting how pollutants will behave and interact with natural elements. Elements with high electronegativity may form harmful compounds when they react with other substances in the environment.
Also read Caldo de Res Traditional Mexican Beef Soup Explained
Conclusion
The electronegativity chart is a vital tool in chemistry, helping to understand how atoms interact in chemical reactions, predict bond types, and determine molecular polarity. By using the electronegativity chart, chemists can make predictions about how atoms and molecules will behave, which is crucial for fields like pharmaceuticals, materials science, and environmental chemistry. Understanding electronegativity is key to unlocking the mysteries of chemical bonding and molecular interactions.